 By now, mostly everyone who owns a website has installed Google Analytics on their site and, if they haven’t, they had better hop on that train ASAP if they want to compete online. Google Analytics allows website owners to track a ridiculous amount of useful information about their site and its users. Within Google Analytics, you can twist the information whichever way you wish in order to look into different aspects, dates, locations, etc. Basically, with the ability to make customized web analytics reports, the possibilities within Google Analytics are endless.
Allow me to start here: this is not a post for analytics beginners. Most of you reading this article work with Google Analytics on a daily basis. For you, my fellow Google analysts, I will present a compilation of 5 cool new features to play with in Google Analytics and ways to use them effectively to benefit your business.
- In-Page Analytics
- Visitors Flow
- Real-Time Data
- Social Reporting
- Motion Charts
1. In-Page Analytics
For each feature, I will begin by mapping out exactly how to arrive there in Google Analytics so we are all on the same page, literally. For in-page analytics, follow these steps:
Log In>Content>In-Page Analytics
 In-page analytics gives you a visual context for your analytics data. Sometimes when looking at an analytics report, it’s difficult to visualize exactly how users are navigating your site. With in-page analytics you are actually able to see your data superimposed on your website as you browse the data, in turn making data analysis much more visually stimulating.
This form of analysis is especially useful for pages that have a lot of links that you want to monitor. Say you have an article posted that has links to other pages in your site and also a call-to-action on the right side. By looking at this article page with in-page analytics, you will be able to see just how effective your links and call-to-actions are. If only 1% of your viewers are clicking on your call-to-action, you may consider changing it to better fit your audience. Similarly, if only a small percentage of viewers are clicking on the links within the page, you may consider testing different keywords as your anchor text for those links. All in all, this is a great tool for those of us who are more visual than textual.
2. Visitors Flow
To navigate your way to visitors flow, follow these steps:
Log In>Audience>Visitors Flow

The visitors flow is a graphical representation of the different routes visitors take when navigating through your site. It shows the various paths taken: from the source, through various pages, and ending on the page where viewers exit your site. Now, please allow me to get a little technical for a minute; then we will take a step back and look at the big picture. In the image below you will see nodes and connections. A node is a metric of the dimension by which you are filtering your results. A connection represents a pathway from one node to another including the traffic volume on the path. The options within visitor flow are endless with the option to even set up custom variables.
To choose your nodes, click the drop down menu above the first column of nodes and choose a variable. The default option is to organize your visitors flow by country/territory. If your business has potential customers or clients in different countries, this view may be useful for you to visualize. If not, you can go for a great SEO variable, Keyword. This will separate your visitors by the keyword they typed into Google to find you. You will see where they went once they arrived at your site and see if they are converting or not. If some keywords have higher conversion rates than others, it would be wise to focus some of your SEO effort on those keywords. Overall, while it may be fun to play around with visitors flow, it can also be an extremely useful tool for your SEO efforts.
3. Real-Time Data
To see real-time data, you must be an administrator of the analytics account. If you are cool enough to be an admin, follow these steps to find this beta application (If not, try to keep your chin up and move on to social reporting):
Log In>Home>Real-Time>Overview
 I will start with an overview and breeze over the other 3 options after I explain the basic concepts of this tool. Have you ever been super excited about a new page in your site or a new blog post but had to (im)patiently wait until the next day to see how it performed? Well fret no more little ones; the real-time beta application is here to save the day. Launched in September 2011, real-time is a set of reports that allows you to see what is happening on your site in real-time.
While I do not recommend watching the screen to see if someone new looks at your page, it is useful to see which mediums are working best to bring visitors to your site. To view this data, on the Overview screen click Top Referrals.
You can check if your social media efforts are effective and if not, take this opportunity to increase your efforts. It is important to do the most you can to promote your new pages in real-time because most pages quickly lose their momentum after the first day of being live. Take advantage of this and cater your social media efforts to your real-time data.
4. Social Reporting
To navigate to the social reporting tool, follow these steps:
Log In>Traffic Sources>Social>Overview
Simply put, social media is fabulous. It’s free, brings a lot of traffic to your site, and is great for branding purposes. It is even speculated that the amount of social media attention that certain pages has can affect their ranks on search engines. Social media’s one downfall is that it is hard to track. This is where social reporting in Google Analytics comes in.

The social report allows you to do three main things:
- Identify the entire monetary value of the traffic coming from social media sites and measure how this traffic leads to conversions or assisted conversions.
- Recognize the social behaviors that are happening both on and off your site to help you optimize user experience and increase social media key performance indicators (KPIs).
- Take actual data and use it to make important decisions for your social media efforts.
Arguably the most important report within social reports is the overview report. This report allows you to see social performance at glance and its impact on your site’s conversions. As a side note, you will only be able to see these social reports if you have goals set up in Google Analytics. If you don’t have goals set up, you will get this message when you try to access social reports:
You haven’t defined any goals, so we’re unable to measure the value of social referrals on your site.
Womp womp. Goals are extremely important and if you don’t have any I recommend you set them up as soon as you can.
If your social referrals are bringing you conversions, you will also be able to see whether they are assisted social conversions or last interaction social conversions. Assisted social conversions are social referrals that eventually lead to conversions. This can happen if someone visits your site from a social media site, does not immediately convert, but eventually does convert. Last interaction social conversions are a better indication of social media’s effect. These are social media referrals that convert immediately.
I urge you to go through the rest of the social media reports to see the impact of your social media efforts on your site performance. Some people call these reports “vanity reports”. While they can be useful for an ego boost if you are having a bad day, they are actually extremely useful when planning your social media strategy.
5. Motion Charts
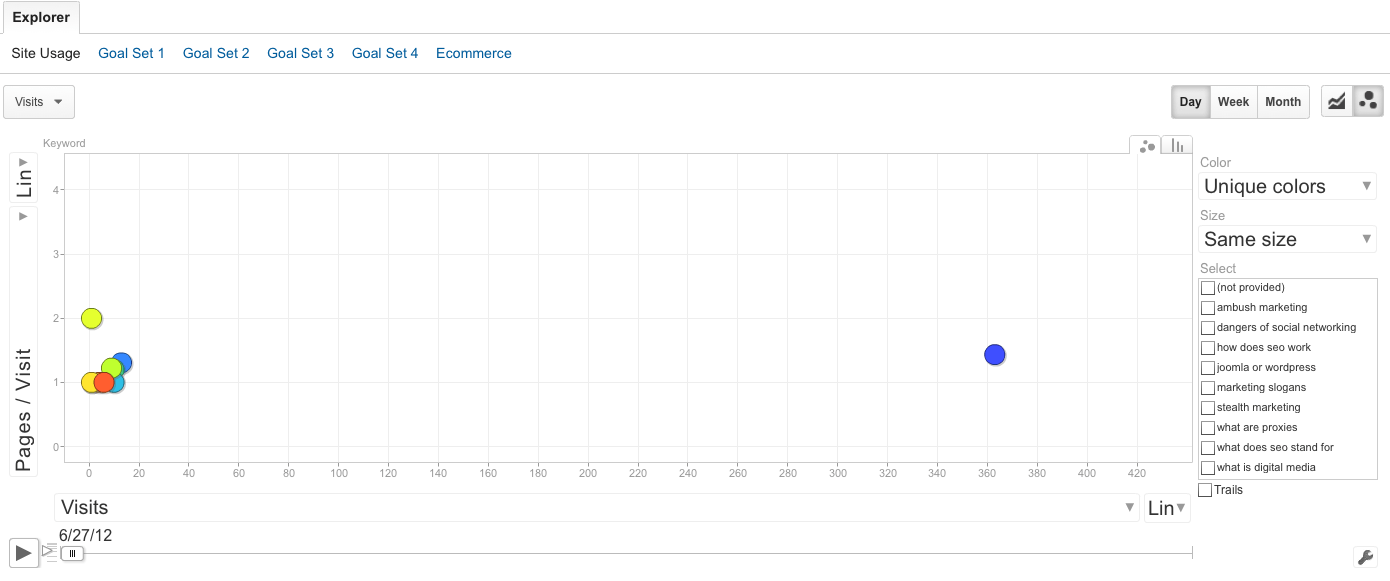
There are different reports that you can turn into motion charts but I will focus on the keywords report because it is especially important for SEO. Here is how you locate motion charts for search keywords in analytics:
Log In>Traffic Sources>Sources>Search>Organic>Click the 3 dots on the right side of your graph

Motion charts allow a Google Analytics user to do both high-level analysis of long-term trends and extremely targeted analysis of specific changes or events. I know since arriving at the motion chart you have wanted to play around with this tool so if you haven’t yet, go ahead and press the play button on the bottom left of your chart (don’t forget to set the dates to whatever is pertinent to data you wish to analyze). As you can see, each colored ball represents a different keyword that was used to find your site during the set time frame. If you scroll over each ball, you will see the keyword that it represents. On the left side of the chart, you can change your variables. I recommend changing the “size” to Goal Conversion Rate if you really want to see some valuable data. That will make each ball a different size according to that term’s conversion rate on your site. You will then see how this changed over the month (or whatever period of time you entered). Another tool that is both fun and useful is “trails”. If you click on one keyword ball and then press “trails”, when you press play that keyword ball will leave a trail of where it went over that particular length of time. With that information, you can analyze how keywords are doing on an individual level.
As you can see, there are infinite ways to play around with and hopefully effectively use motion charts in Google Analytics. All in all, motion charts can be extremely effective in visualizing your data and narrowing down the important information that you wish to track.
There is no doubt that Google Analytics is an extremely effective tool for analyzing your website’s data. Not only is it an amazing program with a huge amount of analysis tools, it is absolutely free! If website performance analysis is not your thing or you feel that you could benefit from expert advice, contact Optimum7 and see how we can help improve your site’s performance.